AI Resolution Rate: How to Calculate It, What Counts as Resolved, and What a Good Number Is
Compiled by Alex Gomez. Published October 5, 2026 · Last updated October 5, 2026.
AI resolution rate is the share of conversations an AI agent finishes end to end, with no human completing the work and no repeat contact on the same issue. It is the headline number among AI agent metrics, and the easiest to inflate, because every vendor picks its own rules for both halves of the fraction.
TL;DR: Every AI resolution rate is a numerator and a denominator, and vendors choose both — Intercom's documentation shows the same 250 resolutions scoring 33% or 50% — so never compare two rates until you know what each one counts and divides by.
Methodology & sources
- Definitions and formulas read from the live pages of Zendesk, Intercom (Fin), Ada, Talkative and Aissist.io.
- Benchmarks from Fin's published fleet data, the My AskAI 195-deployment dataset (as reported by Lorikeet and The Context Company), Comm100 (as reported by Lorikeet), Gartner, and Aissist.io's published figures. Each benchmark row states its denominator and sample.
- The worked example uses illustrative numbers, labelled as such.
- All figures verified October 2026. Disclosure: this is Aissist's blog, and Aissist sells AI agents that are measured on this metric.
What is AI resolution rate, and how do you calculate it?
AI resolution rate equals conversations the AI resolved, divided by the conversations you count as eligible, times 100. Zendesk's AI resolution rate guide gives the textbook version: an agent that handles 200 requests and fully resolves 150 scores 75%. That formula is correct. It is also where the trouble starts, because both halves of the fraction are judgement calls.
Here is one month at a hypothetical support team (illustrative numbers):
| Step | Conversations |
|---|---|
| All inbound conversations | 10,000 |
| Routed to the AI agent | 8,000 |
| AI actually answered (others escalated by rule first) | 6,000 |
| Ended with no human handoff | 4,200 |
| …of which the customer abandoned without confirming | 600 |
| …of which the customer came back within 72 hours | 300 |
| Verified resolutions (4,200 − 600 − 300) | 3,300 |
Now pick a fraction:
| Numerator ÷ Denominator | Resolution rate |
|---|---|
| Verified resolutions ÷ all inbound | 33% |
| Verified resolutions ÷ routed to AI | 41% |
| Verified resolutions ÷ AI answered | 55% |
| No handoff ÷ AI answered | 70% |
Same team, same month, same customers. The spread is 37 points, and nobody lied. The first row is what finance cares about — the share of total workload removed. The last row is containment rate dressed up as resolution. Most published numbers sit near the bottom of this table, and almost none say which row they are.
What counts as "resolved"? Four definitions in use today
Vendors disagree on the numerator: some count only confirmed fixes, some let a model judge quality, some count silence, and one counts a good handover. Each choice is defensible. Each moves the number in a predictable direction.
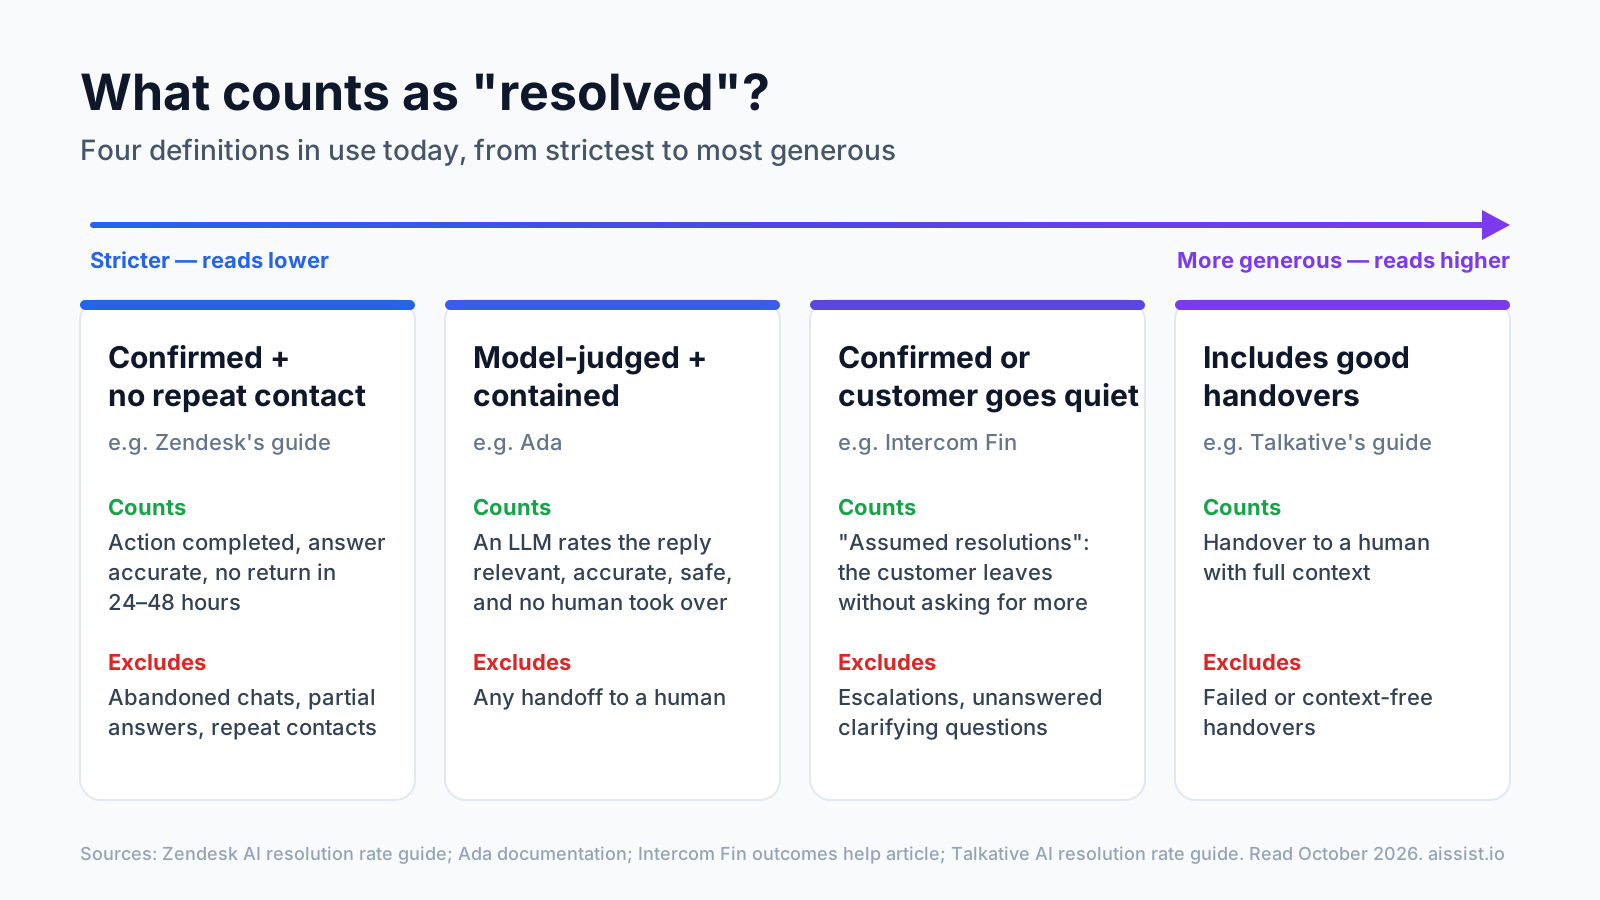
| Definition of "resolved" | Who uses it | Includes | Excludes | Bias |
|---|---|---|---|---|
| Confirmed + no repeat contact | Zendesk's guide (24–48 hour window) | Completed actions, accurate answers | Abandoned chats, partial answers, repeat contacts | Strictest; reads low |
| Model-judged quality + contained | Ada's documentation | Conversations an LLM rates relevant, accurate, safe and contained | Any handoff to a human | Depends on the judge model |
| Confirmed or no further help requested | Intercom Fin outcomes | "Assumed resolutions" where the customer leaves | Escalations, unanswered clarifying questions | Reads high; silence counts |
| Includes successful handover | Talkative's guide | Handovers to a human with context | Failed or context-free handovers | Most generous; work still unfinished |
The words on the label matter as much as the rules. Lorikeet's analysis of the My AskAI dataset found figures labelled "resolution" had a 72.5% median (108 deployments) versus 61% for figures labelled "automation" (52 deployments) — an 11.5-point gap before any difference in capability, per Lorikeet's write-up.
Some vendors skip the word "resolution" altogether. Freshworks CEO Dennis Woodside reported deflection, not resolution, in August 2026:
"Freddy AI Agent deflection rates average 50%" — Dennis Woodside, CEO and President, Freshworks, via CX Today
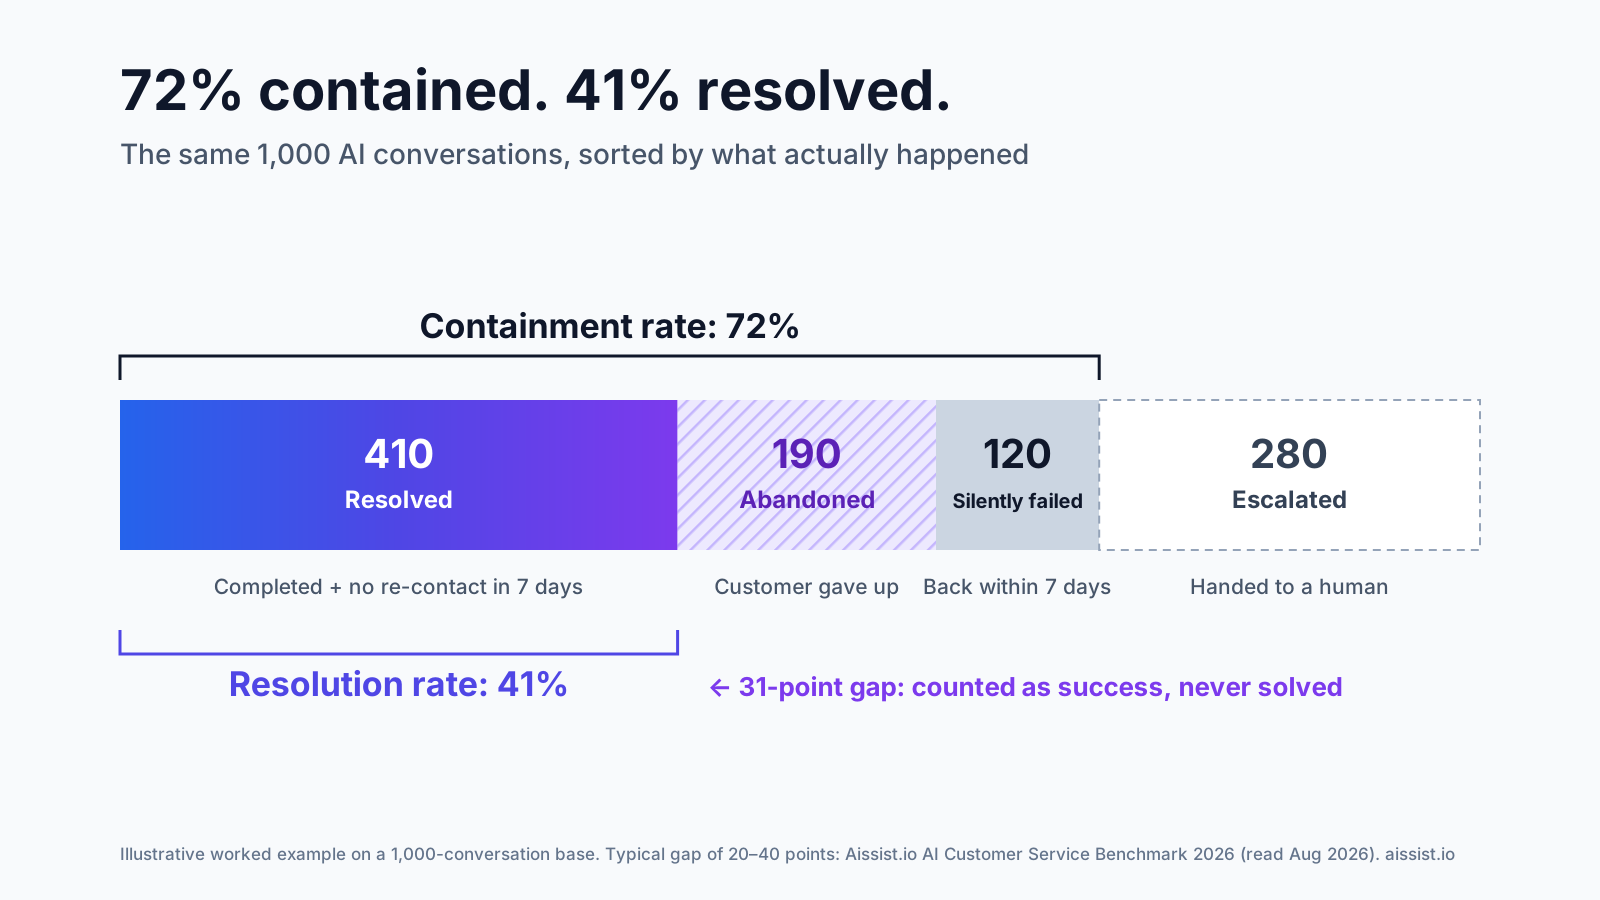
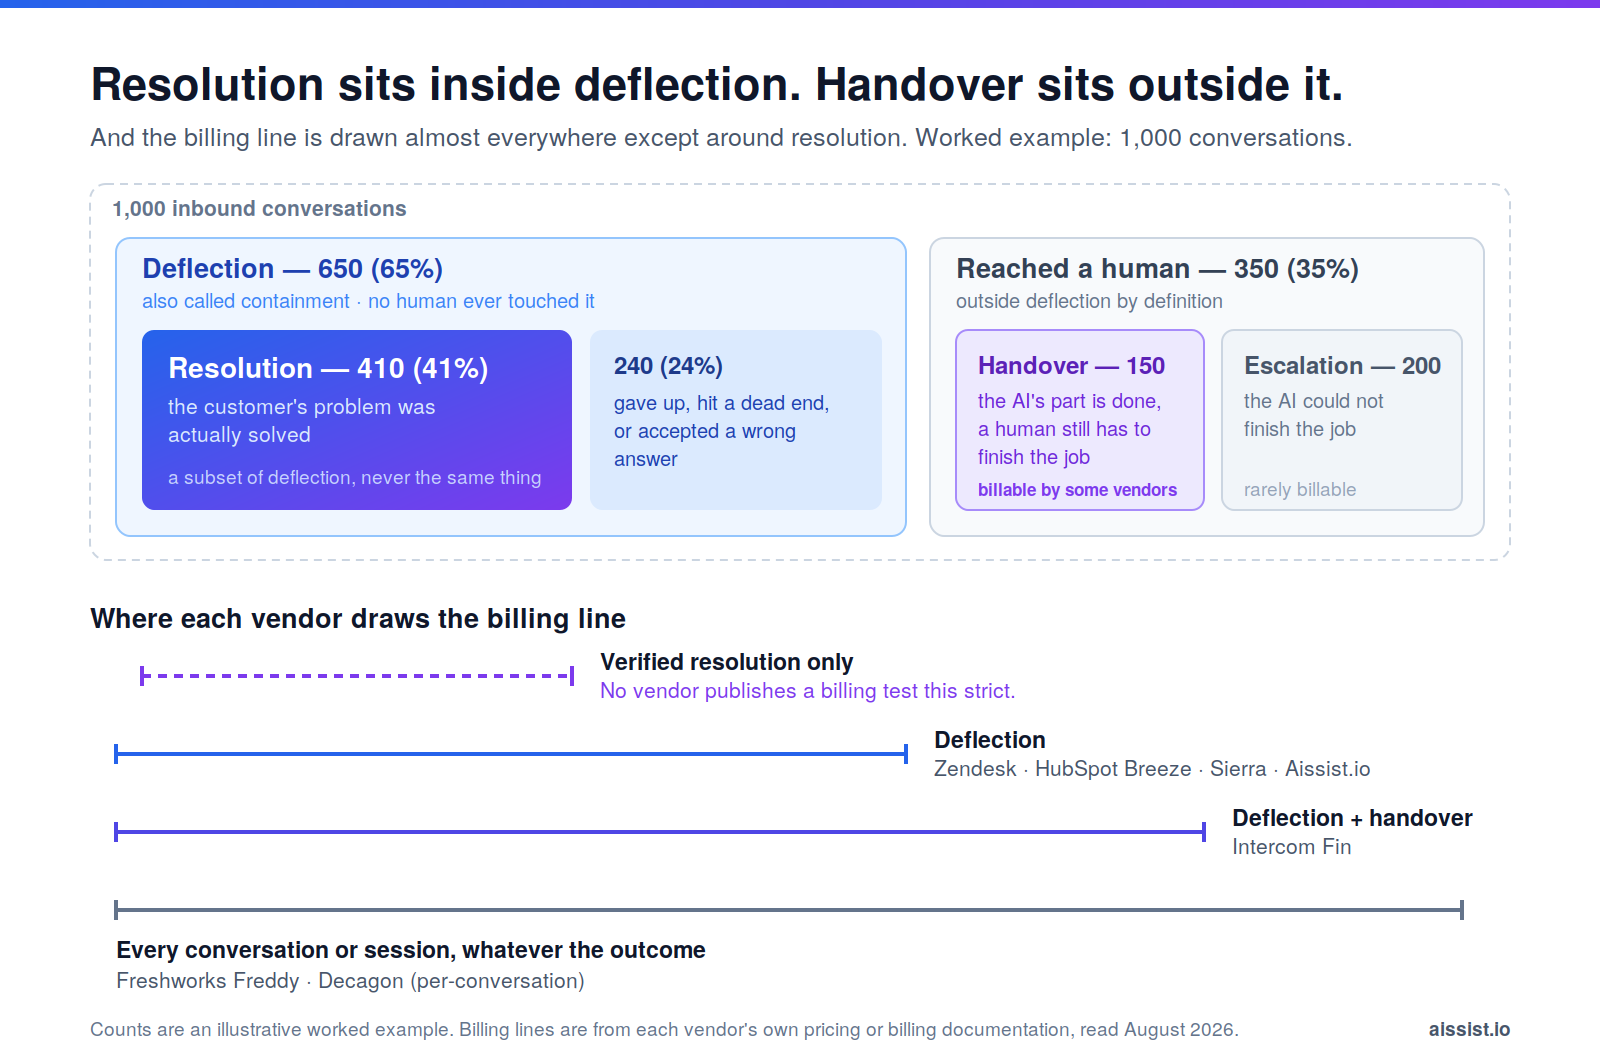
That candour helps. Deflection counts every conversation that never reached a human, including customers who gave up, which is why Aissist's 2026 benchmark puts deflection 20–40 points above genuine resolution on the same deployment.
How do denominators change the number?
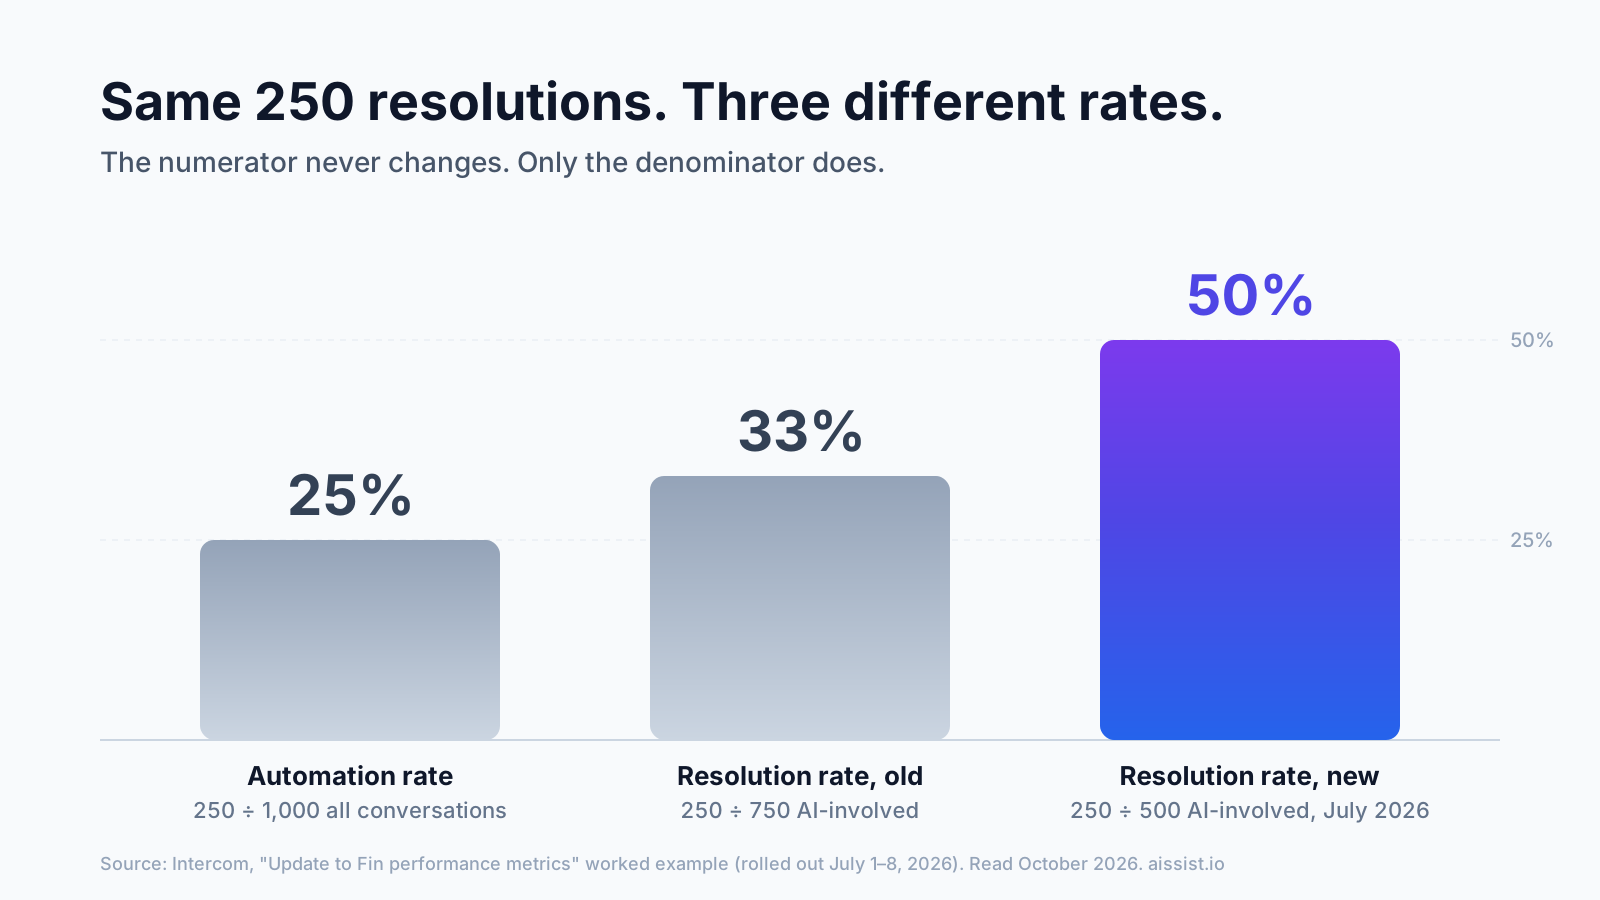
The denominator is the quieter lever, and it can move a rate 17 points without a single extra customer being helped. Intercom proved it in July 2026, publicly and to its credit.
Intercom's update to Fin performance metrics, rolled out July 1–8, 2026, stopped counting conversations where Fin was active but never got to reply. In Intercom's worked example, the resolution rate went from 250 ÷ 750 = 33% to 250 ÷ 500 = 50%. The automation rate — resolutions over all conversations — stayed at 25%. Intercom states plainly: "The number of resolutions is not changing."
The new definition is arguably fairer to the AI. It is also a different number, and any chart spanning July 2026 now compares two metrics with the same name.
Three denominator questions settle most disputes:
- All inbound, or only AI-routed? Routing easy intents to AI and hard ones to humans lifts the rate without lifting capability.
- Are pre-answer escalations excluded? If rules escalate before the AI speaks, removing those conversations helps the ratio.
- Conversations or messages? Aissist's reliability benchmark uses conversations, because a message-level denominator inflates volume and flatters the rate.
A rate is a fraction. Read the bottom half first.
What is a good AI resolution rate?
A mature AI agent typically resolves 60–80% of the conversations it handles, with a 70% median across 195 published deployments — but only figures with a stated denominator can be compared. Here is every benchmark on this page, with what each one divides by.
| Source (read Oct 2026) | Figure | Numerator | Denominator / sample | Provenance |
|---|---|---|---|---|
| My AskAI dataset, May 2026 | 70% median, middle half 56–80% | Mixed vendor definitions | 195 deployments, ~55 vendors | Independent compilation |
| Fin | 76% average | Confirmed or no follow-up | Conversations Fin handled, 8,000+ customers | Vendor-claimed |
| Fin benchmarks, updated May 2026 | 85% resolution, 78% automation (top 10) | Confirmed or no follow-up | 110M+ conversations, 12,000+ customers, last three months | Vendor-claimed |
| Comm100, via Lorikeet | 44.8% | AI resolution, unfiltered | 220M+ live chat interactions | Independently reported |
| Aissist.io synthesis | ~41% median, ~59% top quartile | Tier-1 automation | Published sources, 2024–2026; no sample of its own | Secondary synthesis |
| Aissist.io | 83% average | No human, no repeat contact | AI-handled conversations; sample size not published | Vendor-claimed |
| Gartner, Dec 2023 survey | 14% fully resolved in self-service | Customer-reported | 5,728 customers, all self-service | Independent survey |
The spread from 14% to 85% is mostly definitions, not quality; for the industry-by-industry view, see average AI resolution rate in 2026. Fin's two rows show it neatly: fleet average versus top ten, both counting only conversations Fin handled. Gartner's row measures something else entirely — the customer's view of all self-service — which is why its analyst sounds less impressed than any vendor:
"it's concerning to see that so few fully resolve there." — Eric Keller, Senior Director of Research, Gartner Customer Service & Support
We hold our own row to the same standard. Aissist publishes the definition and the denominator type, not yet a conversation count — the gap this article asks every vendor to close.
Which metrics should sit next to resolution rate?
Pair resolution rate with CSAT on AI-handled conversations and a re-contact rate, because a resolution rate alone can be raised by closing tickets nobody solved. Each companion metric catches a different way of gaming it.
| Metric | What it measures | How it gets gamed | What catches it |
|---|---|---|---|
| Containment rate | Conversations that never reached a human | Hide the "talk to a human" button | Re-contact rate, CSAT |
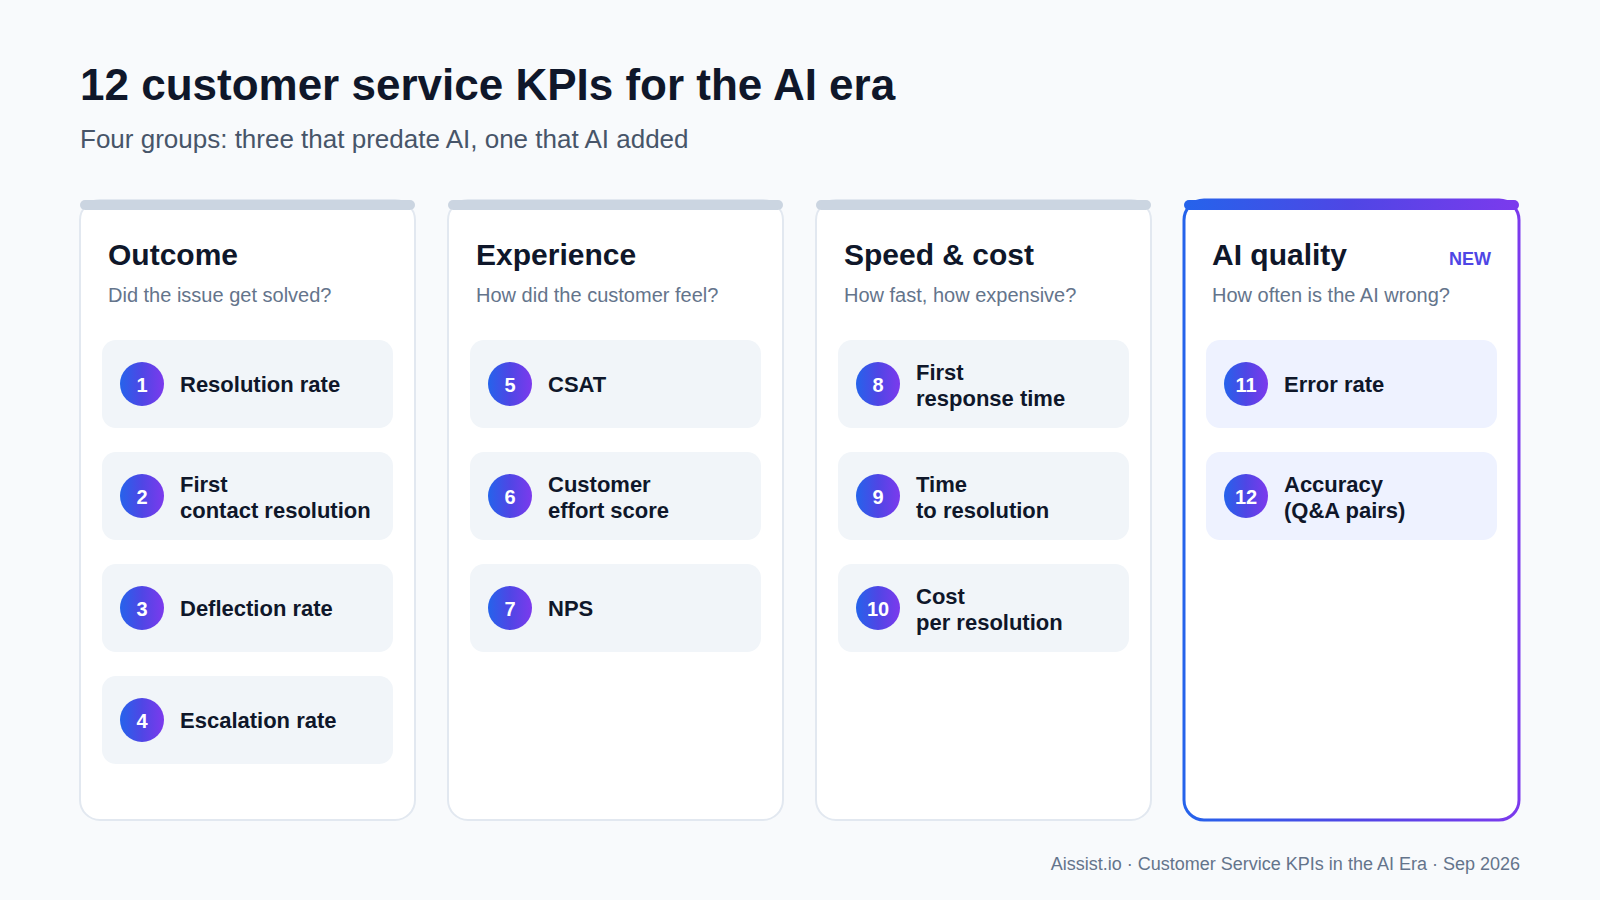
| First contact resolution | Issues solved with no repeat contact in a window (72 hours in Aissist's KPI guide) | Shorten the window | Fixed, published window |
| Average handle time | Minutes per conversation | Close conversations early | Re-contact rate |
| Cost per resolution | Total cost ÷ resolved issues | Count assumed resolutions | Verified numerator |
| Re-contact rate | Share of "resolved" issues that return | Treat a new channel as a new issue | Customer-level matching |
| CSAT on AI conversations | Customer satisfaction where AI handled it | Survey only resolved chats | Survey all AI conversations |
Aissist's 2026 benchmark reports AI-handled CSAT typically running 5–10 points below the same team's human-handled score — and its resolution-CSAT analysis argues satisfaction tends to fall once teams push automation past the work the AI can actually finish. Resolution without CSAT is a speedometer without a fuel gauge.
Raising the honest number is unglamorous work:
"If you invest in understanding, adoption, and great content, AI performance takes off." — Yamine Gluchow, VP of Information Systems, Lightspeed, via Fin
Resolution rate is a ratio — read the bottom half first
AI resolution rate is the right headline metric for an AI agent, and the easiest to flatter. Whether you are setting a resolution rate customer service target or checking a vendor's claim, hold the number to five lines — the Aissist resolution-rate standard:
- Numerator: issues finished end to end, with no human completing them.
- Exclusions: abandoned and assumed resolutions removed.
- Re-contact window: stated in hours, and fixed.
- Denominator: all AI-handled conversations, with the all-inbound rate beside it.
- Sample: conversation count and date window.
A vendor that fills in all five has a number worth comparing. One that answers "it depends" has told you which row of the table it picked. To see where your own rate lands, try Aissist's resolution rate benchmark tool; for the billing side, read deflection vs resolution rate.
Frequently asked questions
What is the formula for AI resolution rate?
AI resolution rate = conversations the AI resolved end to end ÷ eligible conversations × 100. Always state what counts as resolved and which conversations are eligible, because both choices change the result.
What is the difference between containment rate and resolution rate?
Containment rate counts conversations that never reached a human, including customers who gave up. Resolution rate counts only conversations where the issue was actually solved, so on the same data it normally reads lower than containment. For how to audit a vendor's containment claim, see containment rate.
Is first contact resolution the same as AI resolution rate?
No. First contact resolution measures whether an issue was solved without a repeat contact inside a set window, across human and AI channels. AI resolution rate measures only conversations the AI handled, and may not check for repeat contact at all.
Should abandoned conversations count as resolved?
No. A customer who leaves silently may have given up rather than been helped. Counting abandonment as resolution is the most common way AI resolution rates are inflated.
How long should the re-contact window be?
Common windows run from 24 hours to 72 hours; Zendesk's guide uses 24–48 hours and Aissist's KPI guide uses 72 hours. Pick one, publish it, and keep it fixed so the trend stays comparable.
How fast does AI resolution rate improve after launch?
Aissist's 2026 benchmark reports new deployments typically launching at 40–50% and improving around one point per month, as knowledge content and actions are added.